- Introduction
In the healthcare industry, managing claim denials effectively is a critical component of revenue cycle management (RCM). The Denials Management Dashboard created in Tableau aims to provide healthcare administrators, billing teams, and finance professionals with actionable insights into claim denials. By analyzing patterns, root causes, and financial impacts, this dashboard helps organizations reduce revenue loss and improve operational efficiency.
- Project Objectives
The primary goals of the Denials Management Dashboard are:
- To track and analyze healthcare claims denied by insurance providers.
- To identify trends and key reasons behind claim denials.
- To improve claim approval rates by recognizing and addressing common errors.
- To enhance financial performance by reducing revenue leakage due to denials.
- To assist stakeholders in decision-making through visual data representation.
- Data Sources and Methodology
The dashboard is built using Tableau, integrating data from multiple healthcare sources such as:
- Electronic Health Records (EHR)
- Hospital Billing Systems
- Insurance Claim Databases
- Revenue Cycle Management Software
The data is processed and visualized using:
- Aggregated denial trends over time.
- Categorization of denials based on reason codes, payer type, and claim amount.
- Metrics such as denial rate, financial impact, top denial reasons, and recovery success rate.
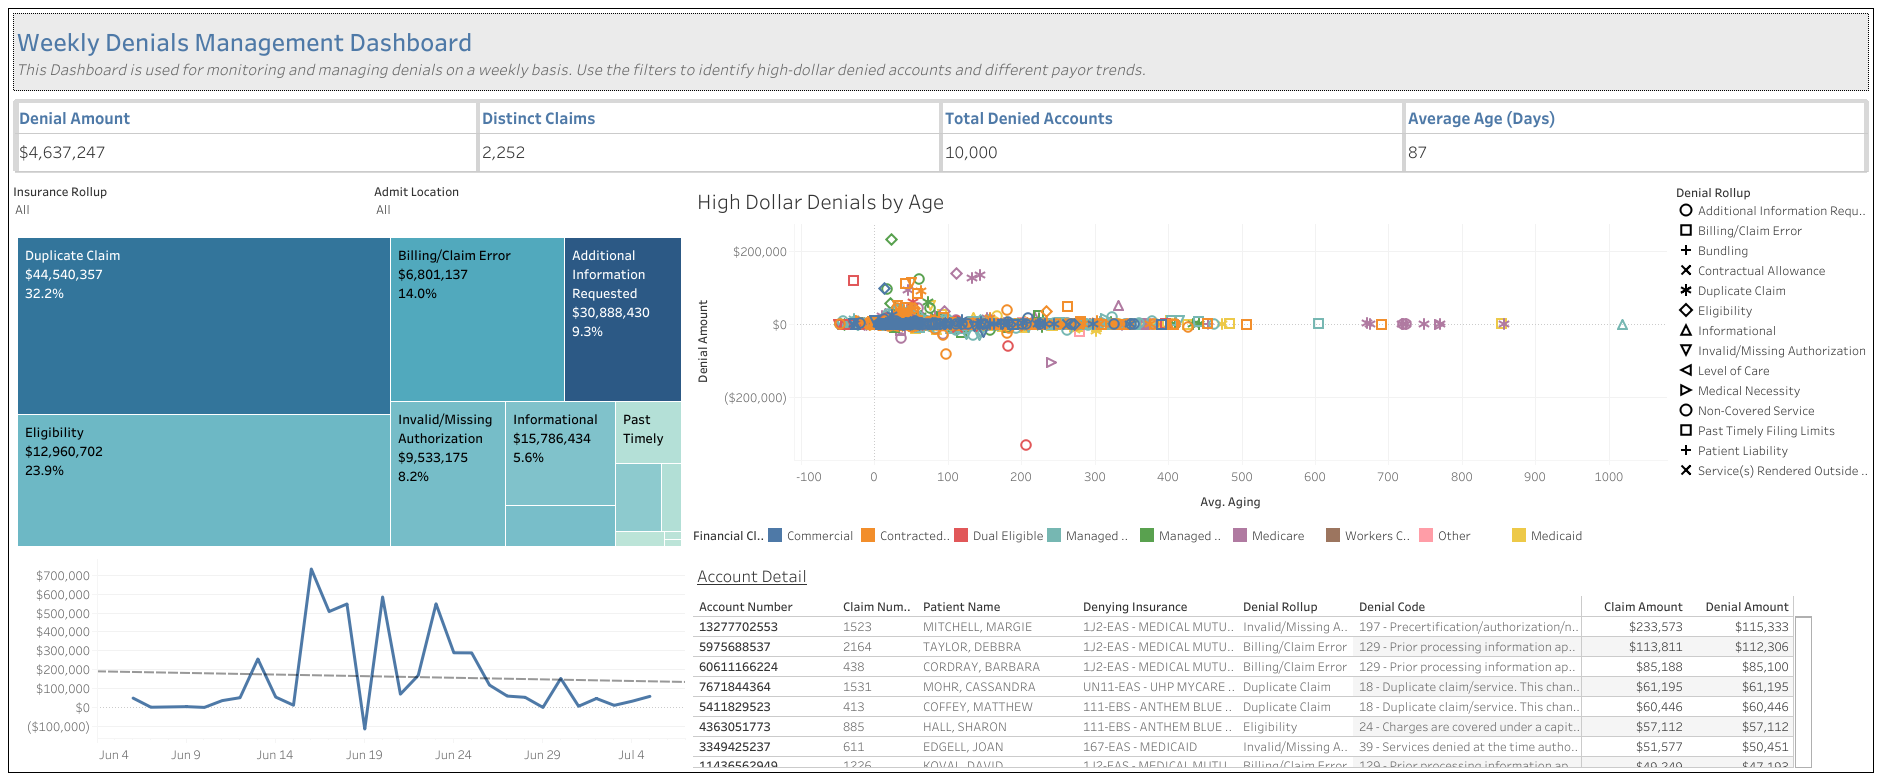
- Key Features of the Dashboard
The Denials Management Dashboard is structured into multiple interactive sections:
- Denial Trends Analysis
- Visualization of denials over time to monitor fluctuations in claim rejections.
- Monthly, quarterly, and yearly trends identify seasonal or systemic issues.
- Denial Categories & Root Causes
- Breakdown of denials by type (coding errors, missing information, eligibility issues, etc.).
- Identification of the top root causes leading to rejections.
- Payer Performance & Denial Rates
- Analysis of denials by insurance providers (Medicare, Medicaid, Private Payers).
- Comparison of denial rates across different payers to highlight inefficiencies.
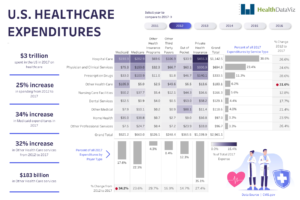
- Financial Impact Assessment
- The calculation of revenue was lost due to denied claims and potential recovery amounts.
- Identification of high value denied claims that need urgent attention.
- Recovery & Appeals Performance
- Insights into appeal success rates and claim reconsideration outcomes.
- Monitoring how many denials were successfully overturned.
- Benefits & Use Cases
The Denials Management Dashboard serves multiple healthcare stakeholders, including:
- Revenue Cycle Teams: Helps in improving claims submission accuracy.
- Finance Departments: Assists in forecasting financial losses due to claim rejections.
- Healthcare Executives: Provides high-level strategic insights into revenue management.
- Insurance and Compliance Teams: Ensures better collaboration with payers to reduce denials.
- Conclusion
This Tableau-based Denials Management Dashboard provides a data-driven approach to addressing claim denials in healthcare revenue cycle management. By leveraging real-time analytics, healthcare organizations can minimize denials, recover lost revenue, and enhance operational efficiency.