Objective
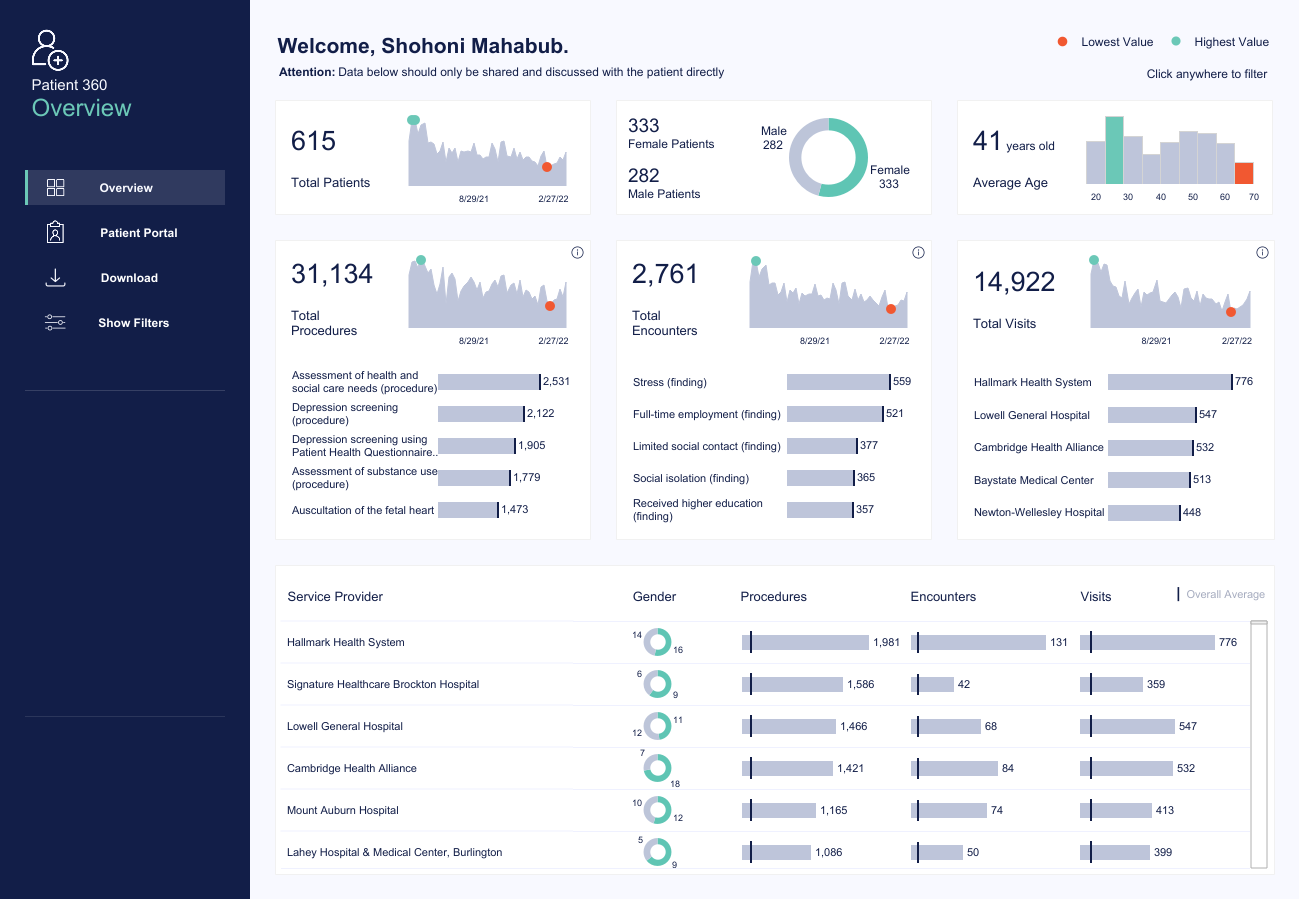
The Patient 360 Dashboard provides a comprehensive view of patient data to assist healthcare providers in monitoring patient demographics, medical procedures, encounters, and hospital visits. The goal of this dashboard is to enable data-driven decision-making, improving patient outcomes and healthcare service efficiency.
Key Features
- Total Patients & Demographics: Displays the total number of patients (615) and their gender distribution (333 females, 282 males). The average patient age is 41 years.
- Procedures Overview: Highlights the total number of procedures performed (31,134), with key procedures including depression screening, substance use assessment, and fetal heart auscultation.
- Encounters & Findings: Shows a total of 2,761 encounters, with stress, full-time employment, and social isolation being notable findings.
- Hospital Visits & Service Providers: Tracks 14,922 visits across multiple hospitals, with Hallmark Health System recording the highest number of visits.
- Data Trends & Visualizations: Each section includes trend graphs to showcase historical patterns and key insights over time.
Technology Used
- Tableau: The dashboard is built using Tableau, leveraging its powerful data visualization capabilities to provide an interactive and user-friendly interface.
- Data Integration: The dashboard aggregates data from multiple sources, ensuring accurate and real-time analytics.
Impact
This dashboard allows healthcare providers to:
- Identify trends in patient health and service usage.
- Enhance resource allocation by understanding high-demand procedures and hospital visits.
- Improve patient care by recognizing key social and medical findings affecting patient well-being.
Next Steps
- Implement advanced filters for deeper analysis.
- Expand data sources for broader insights.
- Integrate predictive analytics for proactive healthcare management