- Introduction
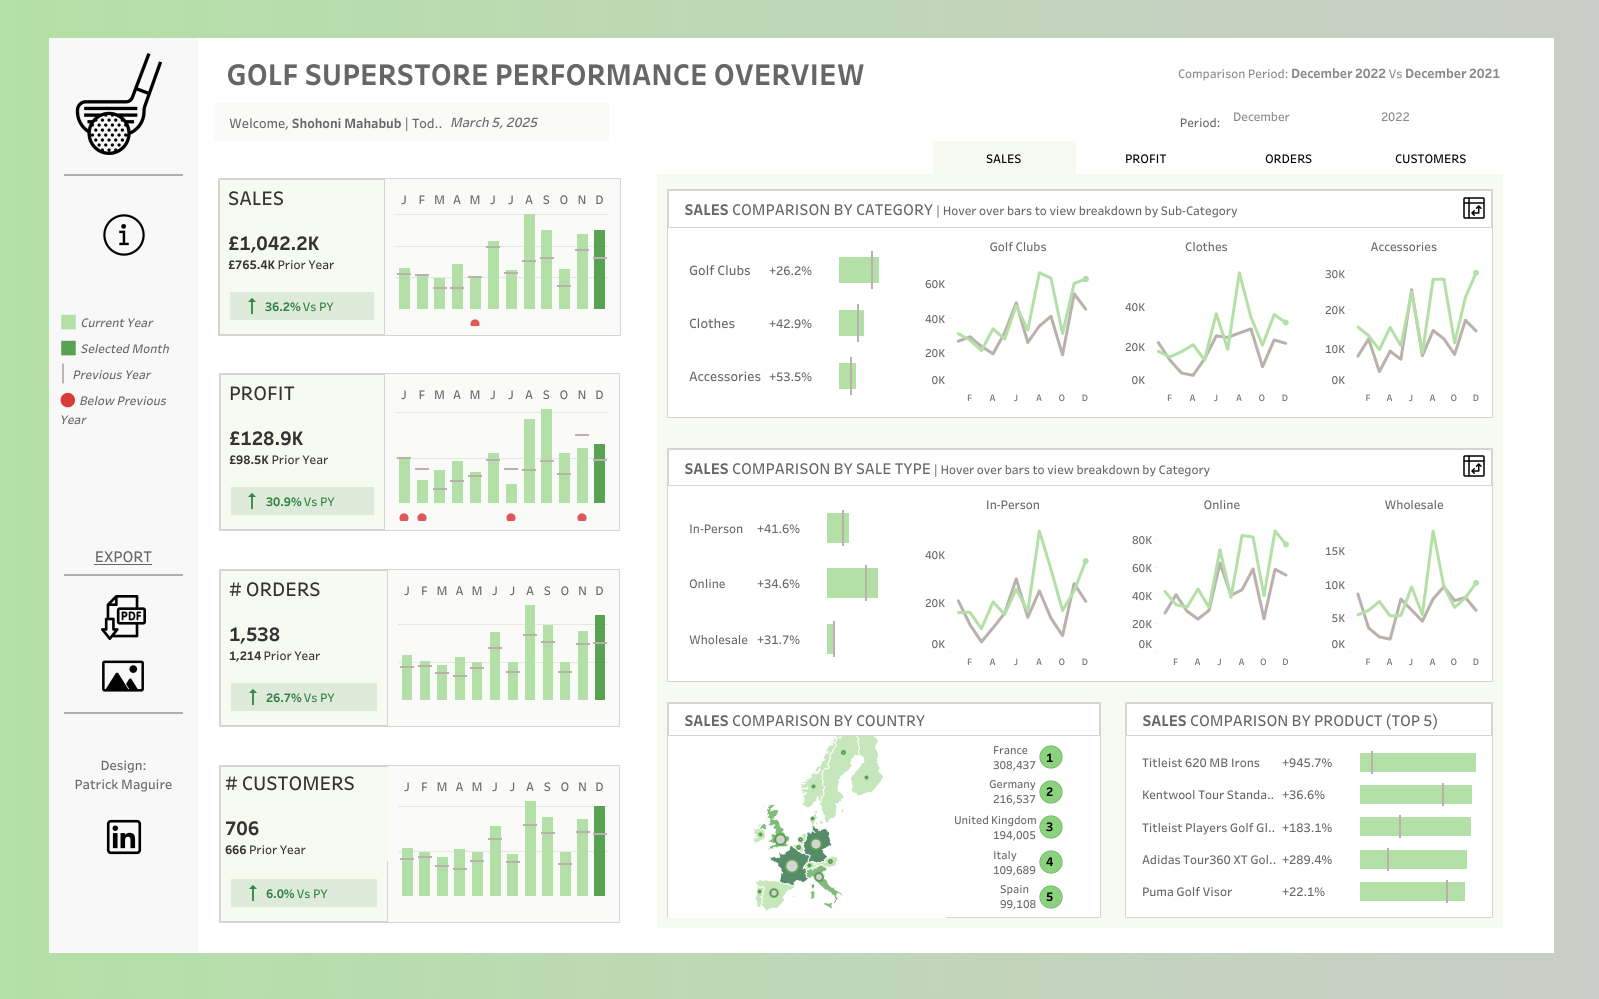
The Golf Superstore Performance Overview Dashboard, created in Tableau, provides an in-depth analysis of the store’s sales performance, customer trends, and key financial metrics. The dashboard is designed to help business owners, sales managers, and financial analysts gain real-time insights into revenue, profit margins, and product performance. By leveraging interactive visual analytics, the project helps in strategic decision-making and operational improvements.
- Project Objectives
The primary goals of this Golf Superstore Performance Dashboard are:
- To track sales revenue and profitability trends over time.
- To analyze product category performance and identify top-selling items.
- To evaluate customer purchasing behavior and trends.
- To monitor regional and store-wise sales performance.
- To assist in inventory optimization by identifying best and worst-performing products.
- To provide a data-driven approach to revenue growth and marketing strategies.
- Data Sources & Technology Used
The dashboard integrates multiple data sources, including:
- Point-of-Sale (POS) Systems – Capturing transaction details and revenue data.
- Inventory Management Systems – Tracking stock levels and product movement.
- Customer Sales Records – Analyzing purchase patterns and frequency.
- Financial Reports – Extracting profit margins and cost data.
Technology Stack Used:
- Tableau – For data visualization and interactive dashboards.
- SQL – To extract and preprocess structured data from databases.
- Excel/CSV – For additional data cleansing and manual inputs.
- Python (Optional Integration) – For deeper statistical analysis and forecasting.
- Key Features & Dashboard Components
- Sales Performance Overview
- Total Revenue & Profit Margin – Visual breakdown of store earnings.
- Monthly & Yearly Sales Trends – Identifies revenue fluctuations over time.
- Comparison of Sales Across Different Regions/Stores – Highlights best-performing locations.
- Product Performance Analysis
- Top-Selling Golf Equipment & Accessories – Identifies high-demand items.
- Least-Selling Products – Helps in inventory optimization and promotions.
- Revenue Contribution by Product Category – Breaks down revenue by clubs, balls, apparel, etc.
- Customer Insights & Purchasing Behavior
- Average Transaction Value – Measures customer spending per purchase.
- Customer Frequency Analysis – Identifies repeat vs. new customers.
- Sales by Customer Segment – Tracks performance of different customer groups.
- Inventory & Stock Turnover Analysis
- Stock Turnover Rate – Identifies how efficiently inventory is sold.
- Out-of-Stock Alerts – Helps in managing stock replenishment.
- Seasonal Sales Trends – Highlights seasonal product demand.
- Results & Business Insights
From the dashboard analysis, the following key insights were observed:
- Peak Sales Periods: Sales spikes were observed in the summer months due to increased golfing activity.
- Top-Selling Products: Golf clubs and premium golf balls contributed the most to revenue.
- Underperforming Categories: Certain golf accessories and apparel had lower sales, indicating potential for promotions or discontinuation.
- Regional Sales Variations: Stores located near golf courses performed significantly better than urban locations.
- Customer Behavior: Repeat customers contributed to 60% of total sales, highlighting the importance of customer retention strategies.
- Business Impact & Use Cases
The Golf Superstore Performance Dashboard serves multiple business functions, including:
- Sales & Marketing Teams – Helps in targeted promotions and seasonal marketing strategies.
- Finance & Business Analysts – Assists in revenue forecasting and budgeting.
- Inventory Managers – Supports data-driven inventory restocking decisions.
- Store Managers – Helps in performance comparisons across different locations.
- Conclusion
The Tableau-based Golf Superstore Performance Overview Dashboard provides a powerful, data-driven approach to managing sales, customer engagement, and inventory. With real-time insights and performance tracking, the dashboard helps optimize revenue, reduce inventory inefficiencies, and improve business decision-making in the retail golf industry.