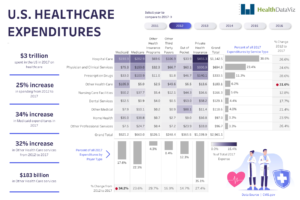
With the rise of digital healthcare, telemedicine has revolutionized patient care by providing remote consultations, reducing in-person visits, and improving accessibility. The Telemedicine Dashboard, developed in Tableau, is designed to help healthcare providers, administrators, and policymakers analyze telehealth trends, patient demographics, provider performance, and financial insights.
This dashboard serves as a data-driven decision-making tool, offering a detailed overview of telemedicine adoption, efficiency, and areas for improvement. By visualizing key performance indicators (KPIs), the dashboard empowers healthcare organizations to enhance patient engagement, optimize resource allocation, and drive better health outcomes.
Key Components and Insights
- Patient Demographics & Telemedicine Adoption
- Age & Gender Distribution: Analyzes the age groups and gender using telemedicine services most frequently.
- Geographical Insights: Identifies telemedicine adoption across rural vs. urban regions.
- New vs. Returning Patients: Tracks the retention rate and frequency of telemedicine visits.
- Language & Accessibility Metrics: Identifies potential gaps in telehealth accessibility for non-English speakers or individuals requiring assistance.
Impact: Understanding patient demographics helps healthcare providers personalize services, enhance accessibility, and address healthcare disparities.
- Telemedicine Consultation Trends
- Monthly, Weekly, and Daily Volume Trends: Tracks fluctuations in telehealth consultations over time.
- Peak Consultation Hours: Identifies the busiest hours and days to help optimize provider schedules.
- Specialty-Wise Breakdown: Shows which medical specialties—such as general medicine, mental health, dermatology, and pediatrics—are most frequently consulted via telemedicine.
- Consultation Duration & Wait Time: Measures average consultation length and wait times to improve efficiency.
Impact: Insights from consultation trends allow healthcare organizations to streamline appointment scheduling, allocate resources effectively, and reduce patient wait times.
- Provider Performance & Efficiency Metrics
- Number of Consultations per Provider: Assesses workload and productivity levels.
- Provider Availability & Response Time: Tracks how quickly providers attend to virtual patients.
- Average Consultation Satisfaction Score: Aggregates patient feedback on doctor interactions.
- Telemedicine Drop-Off Rates: Measures the percentage of patients who abandon a virtual visit before completion.
Impact: Provider performance insights help optimize workforce management, improve doctor-patient engagement, and enhance service quality.
- Technology Usage & Patient Engagement
- Device Preferences: Breaks down usage between mobile, desktop, and tablets for telemedicine access.
- Platform Utilization: Compares patient engagement across web-based platforms, mobile apps, and direct video calls.
- Internet Connectivity & Technical Issues: Identifies common tech-related barriers affecting telehealth adoption.
Impact: This data supports efforts to improve platform usability, enhance mobile experiences, and address technical difficulties that impact virtual healthcare.
- Financial & Revenue Insights
- Billing & Payment Trends: Analyzes revenue generation from telemedicine services.
- Insurance vs. Out-of-Pocket Payments: Tracks how patients pay for virtual consultations.
- Telehealth Cost Savings: Estimates the reduction in hospital admissions and in-person visit expenses due to telemedicine.
- Claim Reimbursement Rates: Assesses how often insurance providers approve telehealth claims.
Impact: These insights help optimize pricing models, reduce administrative costs, and improve reimbursement policies for telemedicine services.
Technology Stack & Data Sources
- Tableau: Used for advanced data visualization and dashboard design.
- Electronic Health Records (EHR): Integrated to track patient consultations and medical histories.
- APIs & Web Analytics: Analyzes patient engagement and platform usage trends.
- Insurance & Billing Data: Used to track financial performance and claim reimbursements.
Applications & Real-World Impact
- Enhancing Telehealth Accessibility
By analyzing patient demographics, healthcare providers can identify underutilized regions and ensure telemedicine is accessible to vulnerable populations, including senior citizens, rural communities, and those with disabilities.
- Improving Operational Efficiency
- Reducing patient wait times through optimized scheduling.
- Enhancing physician availability based on real-time demand.
- Addressing technical issues to improve patient experience.
- Driving Cost Efficiency in Healthcare
- Reducing hospital readmission rates through preventive virtual care.
- Lowering operational costs by shifting non-urgent cases to telemedicine.
- Enhancing insurance claim approvals with better documentation and tracking.
Future Enhancements & Next Steps
- AI & Predictive Analytics
- Forecasting telemedicine demand based on patient trends.
- Implementing AI-driven virtual assistants for initial consultations.
- Integration with Wearable Health Devices
- Capturing real-time heart rate, blood pressure, and glucose levels from wearables for remote monitoring.
- Personalized Telemedicine Experience
- Offering AI-driven appointment recommendations based on past medical history.
- Implementing chatbots for 24/7 patient support.
Conclusion
The Telemedicine Dashboard is an essential tool for healthcare providers, hospital administrators, and policymakers to track telehealth adoption, optimize provider performance, and improve patient engagement.
By leveraging data-driven insights, this dashboard helps the healthcare industry transition towards a more efficient, cost-effective, and patient-centric virtual care model.