- Introduction
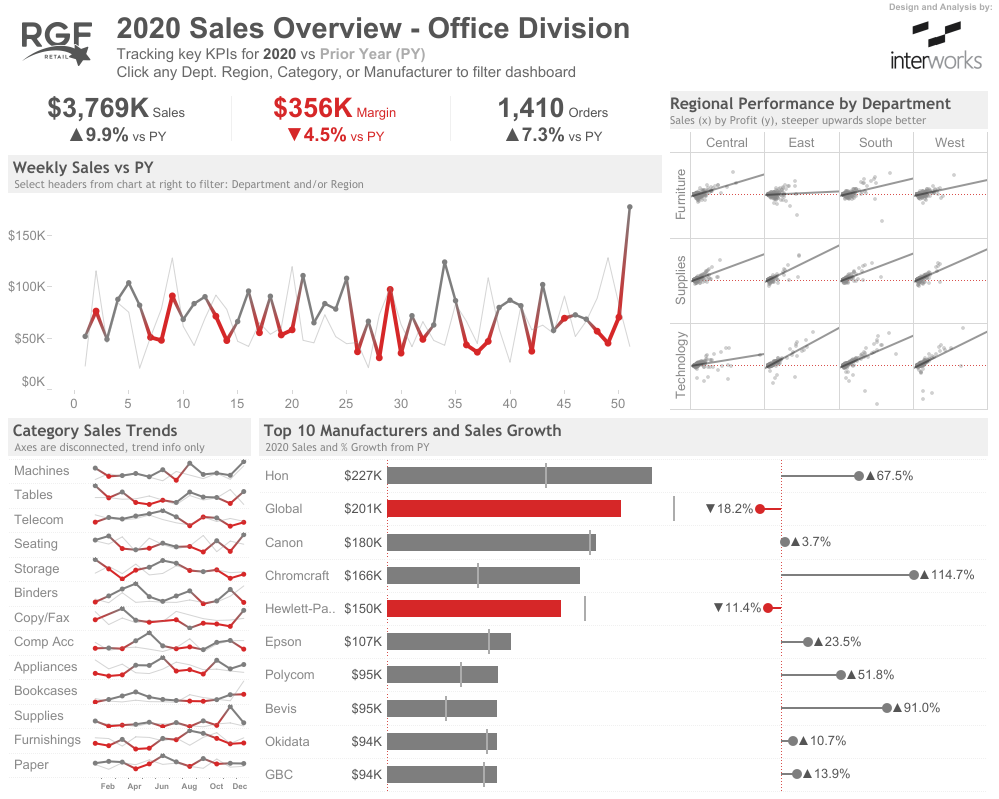
The RGF Retail Sales Review Dashboard, developed in Tableau, provides a comprehensive analysis of retail sales performance, offering valuable insights into revenue trends, product category performance, store-wise comparisons, and customer purchasing behavior. Designed for retail managers, sales executives, and financial analysts, this dashboard helps in data-driven decision-making to optimize sales, enhance profitability, and improve operational efficiency.
By leveraging real-time sales analytics, businesses can track key performance indicators (KPIs) to identify opportunities for growth, reduce inefficiencies, and improve customer engagement.
- Project Objectives
The primary objectives of the Sales Review Dashboard are:
- To analyze total revenue and sales trends over time.
- To track profitability and sales performance by product category.
- To compare store-wise and regional sales performance.
- To evaluate customer purchasing behavior and average transaction value.
- To optimize inventory management by identifying best-selling and slow-moving products.
- To support strategic business decisions using sales forecasting and predictive insights.
- Data Sources & Technology Used
The dashboard integrates multiple retail data sources to ensure a holistic and accurate sales performance analysis.
Data Sources:
- Point-of-Sale (POS) Systems – Captures real-time transaction and revenue data.
- Inventory Management System – Monitors stock levels and turnover rates.
- Customer Data & Purchase History – Provides insights into buying behavior.
- Financial Reports & Sales Forecasting Models – Tracks profitability and future revenue projections.
Technology Stack Used:
- Tableau – For interactive data visualization and dashboard creation.
- SQL – For structured data extraction and transformation from retail databases.
- Excel/CSV – Used for additional manual data inputs and reports.
- Python (Optional) – For advanced sales forecasting and trend analysis.
- Key Features & Dashboard Components
- Sales Performance Overview
- Total Revenue & Sales Growth Trends – Tracks overall sales performance.
- Monthly, Quarterly, and Yearly Sales Comparison – Identifies seasonal trends.
- Sales by Store & Region – Helps evaluate the best and underperforming locations.
- Product Category Analysis
- Top-Selling Products & Categories – Identifies the most profitable products.
- Underperforming Products – Highlights inventory that needs promotional strategies.
- Sales Contribution by Product Line – Evaluates which categories drive the most revenue.
- Customer Insights & Behavior Analysis
- Average Transaction Value (ATV) – Measures how much customers spend per purchase.
- Customer Retention vs. One-Time Buyers – Analyzes loyalty and repeat business.
- Purchase Frequency Trends – Helps in planning marketing and promotions.
- Inventory & Stock Turnover Management
- Stock Turnover Ratio – Assesses inventory efficiency.
- Out-of-Stock vs. Overstocked Items – Helps in optimizing stock levels.
- Demand Forecasting for Replenishment – Uses predictive analytics to avoid stockouts.
- Results & Key Insights
The Sales Review Dashboard provided the following critical insights:
- Revenue Growth: Sales increased by 12% in the last quarter, driven by seasonal promotions and top-performing stores.
- Category Performance: The electronics and apparel segments had the highest sales contribution, while home décor items showed slower movement.
- Store Comparison: The urban locations outperformed rural outlets, indicating higher foot traffic and demand.
- Customer Behavior: 60% of total revenue came from repeat customers, highlighting the importance of customer loyalty programs.
- Inventory Efficiency: The stock turnover rate improved by 8%, but certain items still faced overstocking issues.
- Business Impact & Use Cases
The Sales Review Dashboard benefits various stakeholders, including:
- Retail Store Managers – Helps optimize inventory and in-store sales strategies.
- Sales & Marketing Teams – Guides promotional planning and customer targeting.
- Finance & Business Analysts – Assists in revenue forecasting and budgeting.
- Regional Operations Managers – Provides store-wise comparisons for performance improvement.
- Conclusion
The Tableau-based RGF Retail Sales Review Dashboard delivers a data-driven approach to tracking and optimizing retail sales performance. By integrating real-time sales insights, customer behavior analytics, and inventory management metrics, businesses can increase profitability, improve customer engagement, and streamline operations for long-term success