Overview
- Introduction
The Sales Pipeline – Performance and Insights Accelerator Dashboard, developed in Tableau, provides an advanced analytical framework to evaluate and optimize the sales pipeline, revenue growth, and deal conversion efficiency. Designed for sales managers, executives, and business analysts, the dashboard delivers real-time insights into sales performance, deal progression, and forecast trends. This tool empowers organizations to streamline their sales process, enhance lead conversion, and maximize revenue opportunities.
- Project Objectives
The primary objectives of this Sales Pipeline Dashboard are:
- To provide a comprehensive overview of the sales pipeline, tracking deals at different stages.
- To analyze key sales metrics, such as conversion rates, sales velocity, and revenue growth.
- To identify bottlenecks in the sales process and optimize deal progression.
- To evaluate individual and team performance in closing deals.
- To offer predictive insights for revenue forecasting and sales strategy improvement.
- Data Sources & Technology Used
This dashboard integrates multiple data sources for accurate and insightful sales analytics.
Data Sources:
- Customer Relationship Management (CRM) Data – Tracks deal stages, leads, and conversions.
- Sales Transactions & Revenue Reports – Monitors financial impact and growth.
- Sales Team Performance Data – Assesses individual and team productivity.
- Market & Industry Trends – Benchmarks performance against industry standards.
Technology Stack Used:
- Tableau – For interactive visual analytics and dashboard creation.
- SQL – For extracting and transforming structured sales data.
- Excel/CSV – Used for additional manual data inputs and reports.
- Python (Optional) – For advanced sales forecasting and predictive analytics.
- Key Features & Dashboard Components
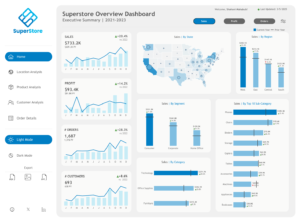
- Executive Sales Overview
- Total Sales Revenue & Growth Trends – Tracks revenue generation over time.
- Sales Pipeline Breakdown – Monitors deal flow across different sales stages.
- Top Performing Sales Channels & Strategies – Identifies the best lead sources.
- Sales Funnel & Conversion Insights
- Lead-to-Customer Conversion Rate – Measures efficiency in converting prospects.
- Sales Cycle Duration & Velocity – Tracks the average time to close deals.
- Drop-Off Analysis – Identifies stages where potential deals are lost.
- Team & Individual Sales Performance
- Sales Target vs. Actual Performance – Tracks goal achievement by sales reps.
- Top-Performing Sales Representatives – Recognizes high performers and improvement areas.
- Deal Closure Rate by Salesperson – Evaluates individual contribution to revenue.
- Revenue Forecasting & Predictive Insights
- Projected Sales Revenue – Forecasts future revenue based on historical trends.
- Pipeline Health Score – Assesses the likelihood of meeting sales targets.
- Market Trends & Demand Analysis – Aligns sales strategies with industry demand.
- Results & Key Insights
The Sales Pipeline Dashboard provided the following critical insights:
- Revenue Growth: Sales revenue increased by 15% quarter-over-quarter, driven by targeted sales strategies.
- Conversion Efficiency: The lead-to-customer conversion rate improved by 8%, reflecting better deal management.
- Bottleneck Identification: The highest drop-off occurred at the proposal stage, indicating a need for better follow-ups.
- Sales Team Optimization: The top 20% of sales reps closed 60% of total deals, highlighting performance disparities.
- Forecast Accuracy: Predictive modeling showed a 90% confidence level in next quarter’s revenue projections.
- Business Impact & Use Cases
The Sales Pipeline Dashboard is beneficial for:
- Sales Executives & Managers – Provides real-time insights to optimize sales strategies.
- Revenue & Financial Analysts – Assists in revenue forecasting and budgeting.
- Marketing Teams – Helps align marketing campaigns with high-converting sales channels.
- Business Operations & Strategy Teams – Improves overall sales efficiency and performance evaluation.
- Conclusion
The Tableau-based Sales Pipeline Performance and Insights Accelerator Dashboard offers a data-driven approach to sales performance management. By integrating key sales metrics, conversion insights, and forecasting models, businesses can enhance sales efficiency, optimize deal flow, and drive sustainable revenue growth.