- Introduction
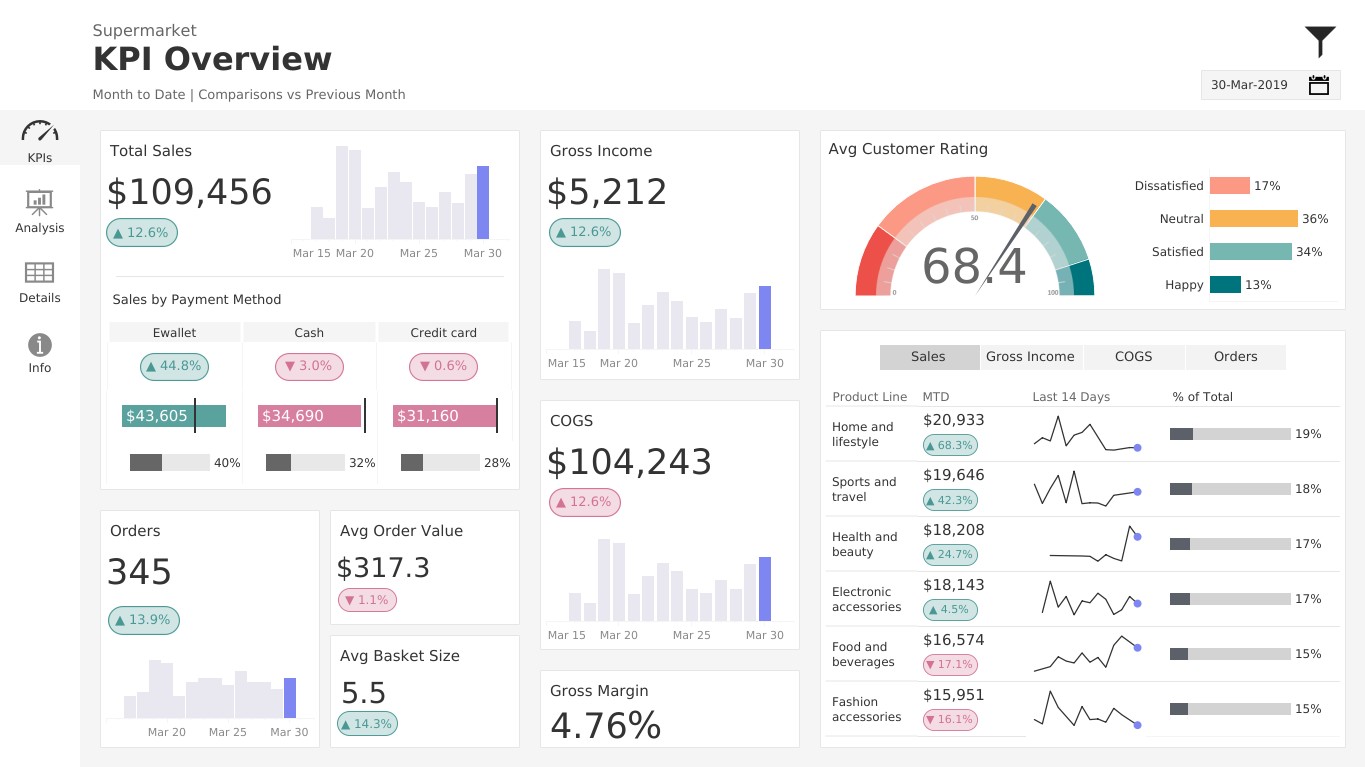
The Supermarket Analysis – KPI Overview Dashboard, built in Tableau, is designed to provide a comprehensive analysis of key performance indicators (KPIs) for a supermarket business. This visualization helps businesses track sales performance, customer purchasing behavior, product category trends, and financial metrics, enabling data-driven decision-making to improve profitability and operational efficiency.
- Project Objectives
The primary objectives of the Supermarket Analysis Dashboard are:
- To monitor and analyze supermarket sales performance over time.
- To track and evaluate key financial and operational KPIs.
- To identify top-performing and underperforming products and categories.
- To provide insights into customer purchasing trends and behaviors.
- To support business decision-making through data-driven strategies.
- Data Sources and Methodology
The dataset used in this project includes point-of-sale (POS) data, inventory records, customer transactions, and financial reports. The analysis covers:
- Sales revenue, profit margins, and transaction volumes.
- Product category performance by sales and profitability.
- Customer trends and spending behavior.
- Store performance comparison (if multiple stores exist).
The Tableau dashboard uses visual analytics, filters, and interactive elements to facilitate real-time data exploration.
- Key Features of the Dashboard
- KPI Overview Section
This section provides a snapshot of key supermarket metrics, including:
- Total Sales Revenue – Tracks overall sales performance.
- Gross Profit & Profit Margin – Measures profitability.
- Total Transactions – Represents customer footfall and sales volume.
- Average Basket Size (Sales per Transaction) – Shows customer purchasing behavior.
- Sales Performance Analysis
- Sales Trends Over Time – Monthly/quarterly/yearly sales performance tracking.
- Sales by Product Category – Identifies best-selling and least-selling categories.
- Comparison of Online vs. In-Store Sales (if applicable).
- Customer Insights & Behavior Analysis
- Average Spending Per Customer – Helps understand customer purchasing power.
- Repeat Customers vs. One-Time Shoppers – Tracks customer retention rates.
- Demographic Insights (if available) – Analyzes customer profiles for targeted marketing.
- Store & Regional Performance (if applicable)
- Sales by Store Location – Compares the performance of different branches.
- Geographical Trends – Identifies high-demand regions for expansion opportunities.
- Product & Inventory Analysis
- Top-Selling & Least-Selling Products – Helps in inventory management.
- Stock Turnover Ratio – Assesses how efficiently inventory is managed.
- Discounts & Promotions Impact – Evaluates sales uplift from discounts.
- Business Impact & Use Cases
The Supermarket Analysis Dashboard serves multiple business functions:
- Retail Managers – Helps in sales forecasting and inventory planning.
- Finance Teams – Assesses profitability and financial health.
- Marketing Teams – Analyzes customer behavior for targeted campaigns.
- Store Operations – Improves store performance and customer experience.
- Conclusion
The Supermarket KPI Overview Dashboard in Tableau provides a data-driven approach to monitoring supermarket performance. By leveraging visual analytics, businesses can optimize sales, improve customer engagement, and enhance operational efficiency to stay competitive in the retail industry.