- Introduction
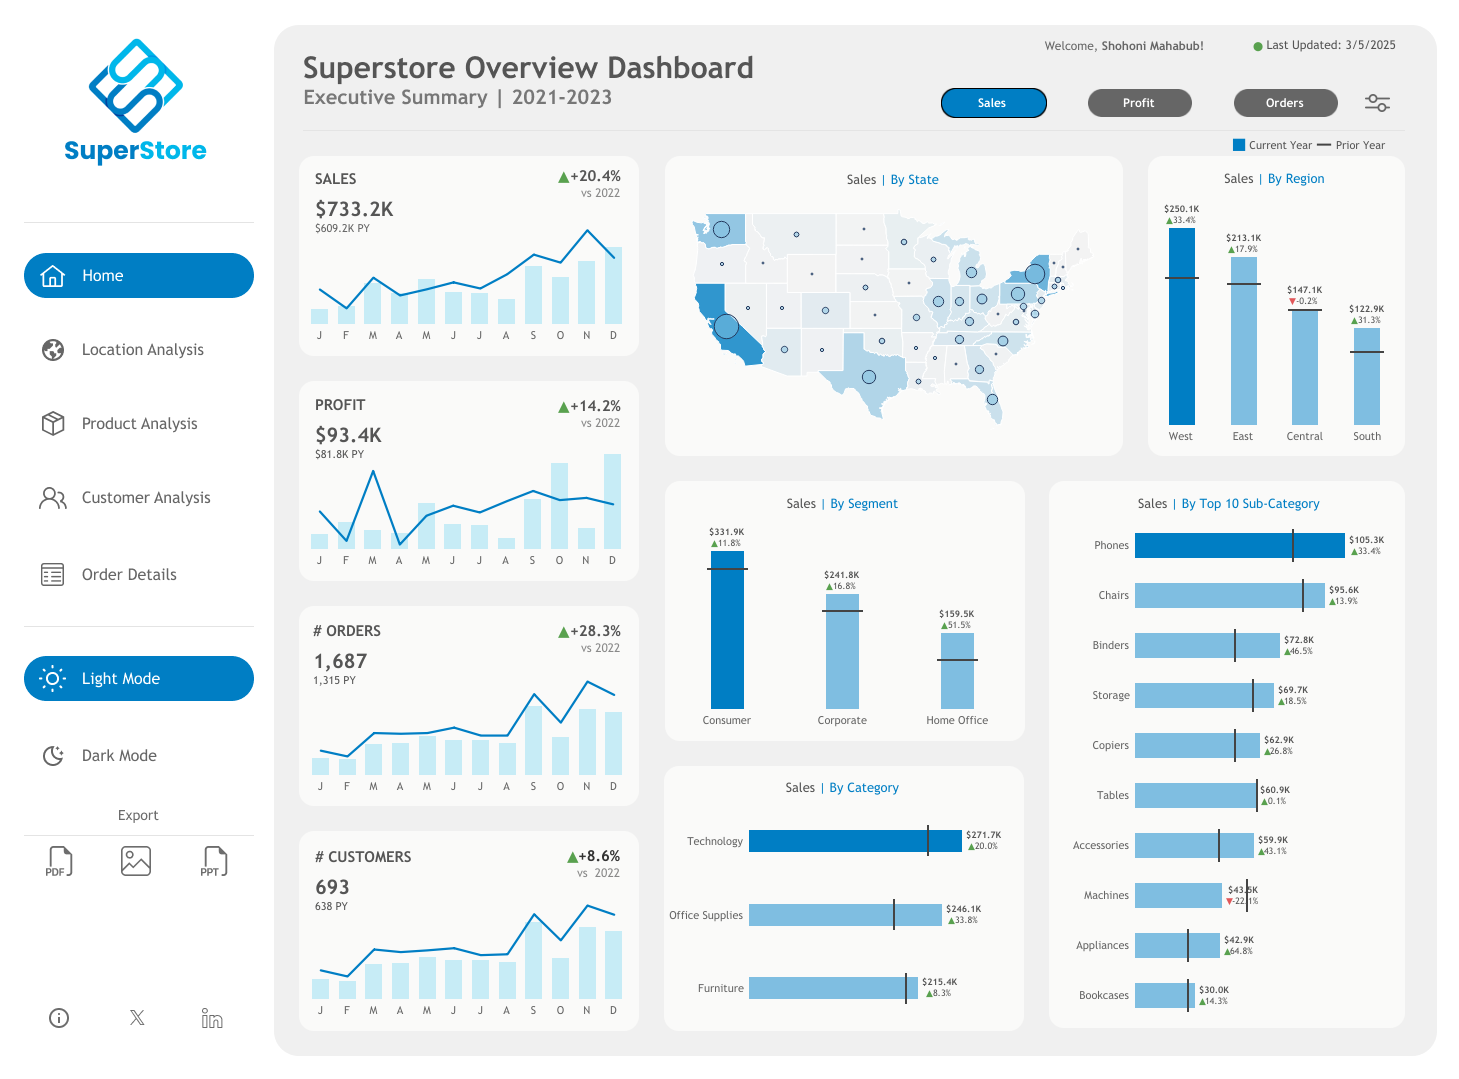
The Superstore Overview Dashboard, developed in Tableau, is designed to provide a comprehensive performance analysis of a retail superstore business. This interactive visualization enables business managers, sales teams, and financial analysts to track key sales metrics, profit margins, customer purchasing patterns, and inventory performance. The dashboard facilitates data-driven decision-making to enhance revenue generation, optimize stock management, and improve operational efficiency.
- Project Objectives
The primary goals of the Superstore Overview Dashboard are:
- To analyze sales performance and revenue trends.
- To track profitability metrics across different product categories.
- To monitor regional sales variations and identify high-performing locations.
- To gain insights into customer purchase behavior.
- To evaluate inventory efficiency and stock movement.
- To support strategic decision-making for business growth and cost optimization.
- Data Sources & Technology Used
This dashboard integrates multiple data sources for a holistic analysis of the superstore’s operations.
Data Sources:
- Point-of-Sale (POS) Systems – Provides transactional data, including sales and customer purchases.
- Inventory Management Software – Tracks stock availability, turnover rates, and replenishment needs.
- Customer Relationship Management (CRM) Data – Helps analyze purchasing behaviors and customer demographics.
- Financial Reports & Excel Files – Provides additional business insights such as expenses and net profit.
Technology Stack Used:
- Tableau – For data visualization and dashboard creation.
- SQL – For data extraction and transformation from structured databases.
- Excel/CSV – Used for pre-processing and manual data inputs.
- Python (Optional) – Utilized for advanced statistical analysis and forecasting trends.
- Key Features & Dashboard Components
- Sales & Revenue Performance Overview
- Total Sales & Revenue Trends – Visual representation of revenue over different timeframes (monthly, quarterly, yearly).
- Profit Margins & Growth Analysis – Helps track overall profitability and net earnings.
- Sales by Product Category – Identifies best-selling and least-selling categories.
- Sales Contribution by Region – Highlights which regions generate the highest revenue.
- Customer Insights & Purchasing Behavior
- Average Transaction Value (ATV) – Measures customer spending per transaction.
- Repeat vs. One-Time Customers – Identifies customer retention trends.
- Demographic Segmentation (if available) – Provides insights into different customer groups and their shopping preferences.
- Inventory & Stock Management
- Stock Turnover Rate – Tracks how frequently products are sold and restocked.
- High vs. Low-Demand Products – Helps in optimizing inventory levels.
- Out-of-Stock Alerts & Overstocking Issues – Ensures effective inventory management.
- Regional & Store-Wise Performance
- Sales by Location – Comparison of different store locations or sales regions.
- Profitability Analysis by Region – Identifies high-performing and low-performing areas.
- Heatmap of Sales Distribution – Visual representation of sales density.
- Results & Key Insights
From the data analysis in the Superstore Overview Dashboard, the following key insights were observed:
- Revenue Growth Trends: The store experienced consistent growth over time, with peak sales during holiday seasons.
- Top-Selling Products: Office supplies and technology products contributed the most to revenue, while furniture sales had lower demand.
- Customer Behavior: Repeat customers accounted for over 55% of total transactions, emphasizing the importance of customer loyalty programs.
- Regional Sales Variation: Certain regions, particularly urban locations, outperformed rural areas due to higher foot traffic.
- Inventory Efficiency: Stock turnover rates varied by category, with some products staying in inventory longer, indicating a need for better demand forecasting.
- Business Impact & Use Cases
The Superstore Overview Dashboard is highly beneficial for various business stakeholders:
- Sales & Marketing Teams – Helps in sales trend analysis and promotional strategies.
- Finance & Business Analysts – Assists in budget planning and revenue forecasting.
- Inventory Managers – Supports stock optimization and demand planning.
- Store Operations & Regional Managers – Provides insights for location-based decision-making.
- Conclusion
The Tableau-based Superstore Overview Dashboard provides a data-driven approach to retail performance analysis. With real-time insights into sales, profitability, customer behavior, and inventory management, businesses can improve operational efficiency, maximize revenue, and optimize inventory. This dashboard serves as a valuable tool for retailers looking to drive sustainable growth and customer satisfaction.