Objective
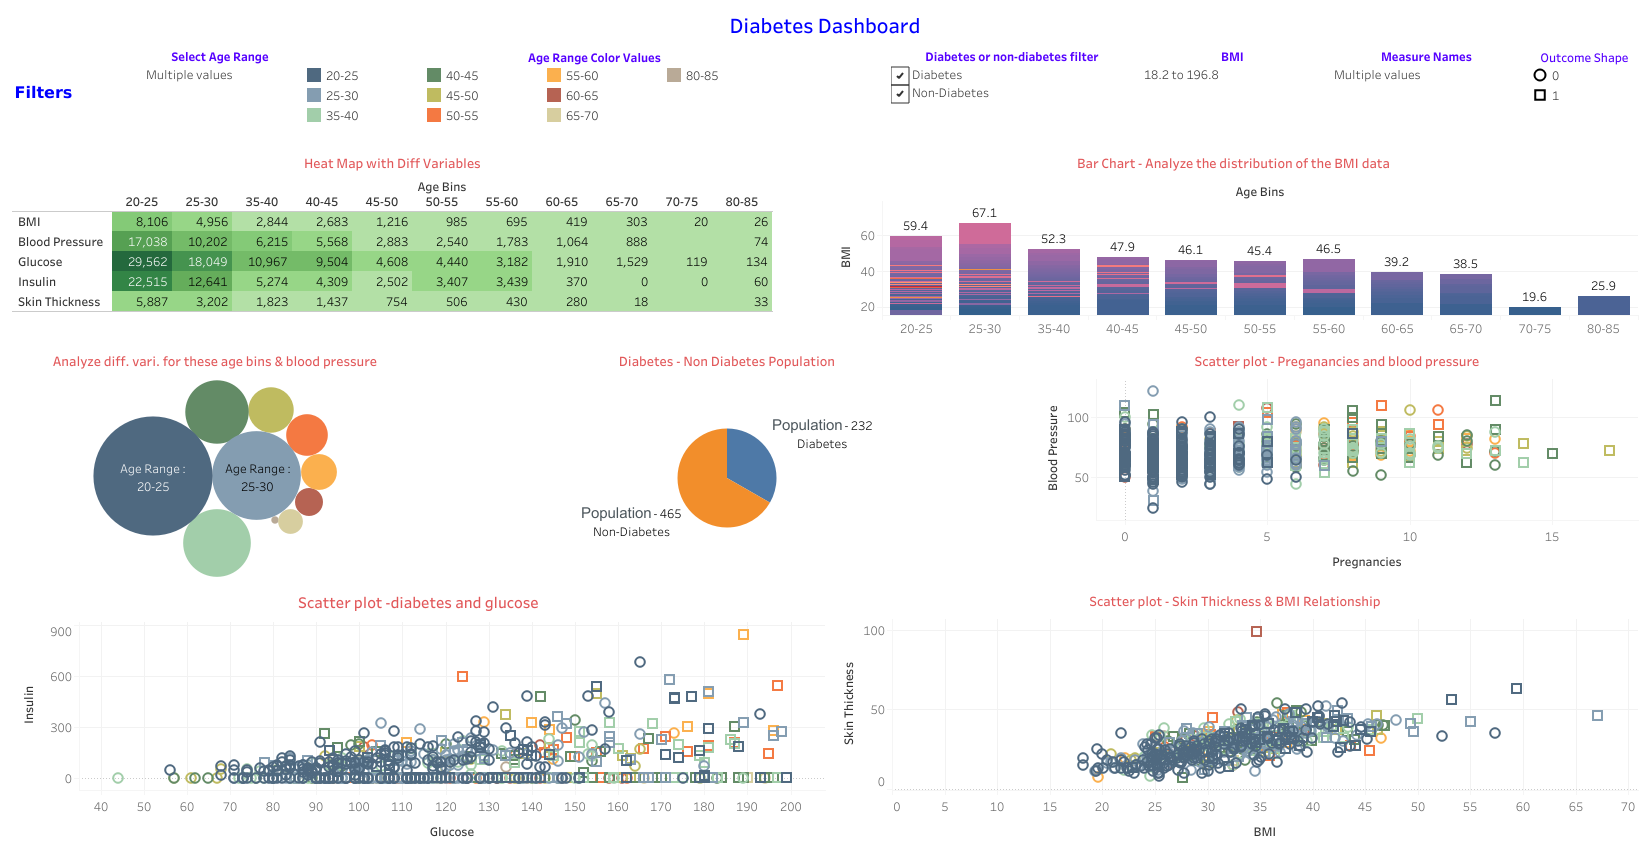
The Diabetes Dashboard, created using Tableau, provides a comprehensive analysis of diabetes-related health metrics. The dashboard enables healthcare professionals, researchers, and analysts to explore key factors contributing to diabetes, compare population distributions, and identify trends based on age, BMI, glucose levels, insulin, and other variables.
Key Insights & Features
- Interactive Filters for Custom Analysis
- Age Range Selection: Users can analyze data across multiple age groups (20-85 years).
- Diabetes vs. Non-Diabetes Filtering: The dashboard allows users to filter between diabetic and non-diabetic populations.
- BMI and Measure Selection: Enables focused analysis on specific variables such as BMI, blood pressure, glucose, insulin, and skin thickness.
- Heat Map: Health Variables Across Age Groups
- A heat map provides an overview of different health metrics (BMI, Blood Pressure, Glucose, Insulin, and Skin Thickness) segmented by age bins.
- Shows clear trends in how these health parameters vary across different age groups.
- BMI Distribution Analysis (Bar Chart)
- BMI levels decline with increasing age, starting from an average of 59.4 (20-25 age group) to 25.9 (80-85 age group).
- Highlights the impact of aging on body mass index and potential correlations with diabetes.
- Diabetes vs. Non-Diabetes Population (Pie Chart)
- Total Population: 697 individuals, with 232 diabetics and 465 non-diabetics.
- Useful for identifying the prevalence of diabetes in the dataset.
- Scatter Plots for Correlation Analysis
- Pregnancies vs. Blood Pressure: Analyzes how the number of pregnancies affects blood pressure levels in diabetic and non-diabetic individuals.
- Glucose vs. Insulin Relationship: Scatter plot highlights the correlation between glucose levels and insulin response, key indicators of diabetes.
- BMI vs. Skin Thickness: Explores the relationship between body mass and skin thickness as a possible diagnostic factor.
Technology Used
- Tableau: For data visualization and dashboard interactivity.
- Healthcare Data Analytics: Focused on diabetes-related health indicators.
- Filters & Interactive Elements: Allows dynamic data exploration.
Impact & Use Cases
- Healthcare Decision-Making: Supports medical professionals in assessing diabetes risk factors.
- Public Health Insights: Helps policymakers track diabetes prevalence across different age groups.
- Data-Driven Research: Facilitates research into correlations between BMI, blood pressure, glucose, and insulin levels.
Next Steps & Enhancements
- Predictive Analytics: Implement machine learning models to predict diabetes risk.
- Demographic Expansion: Introduce gender, ethnicity, and lifestyle factors to enhance insights.
- Time-Series Analysis: Track how diabetes trends evolve over time for better forecasting.