Objective
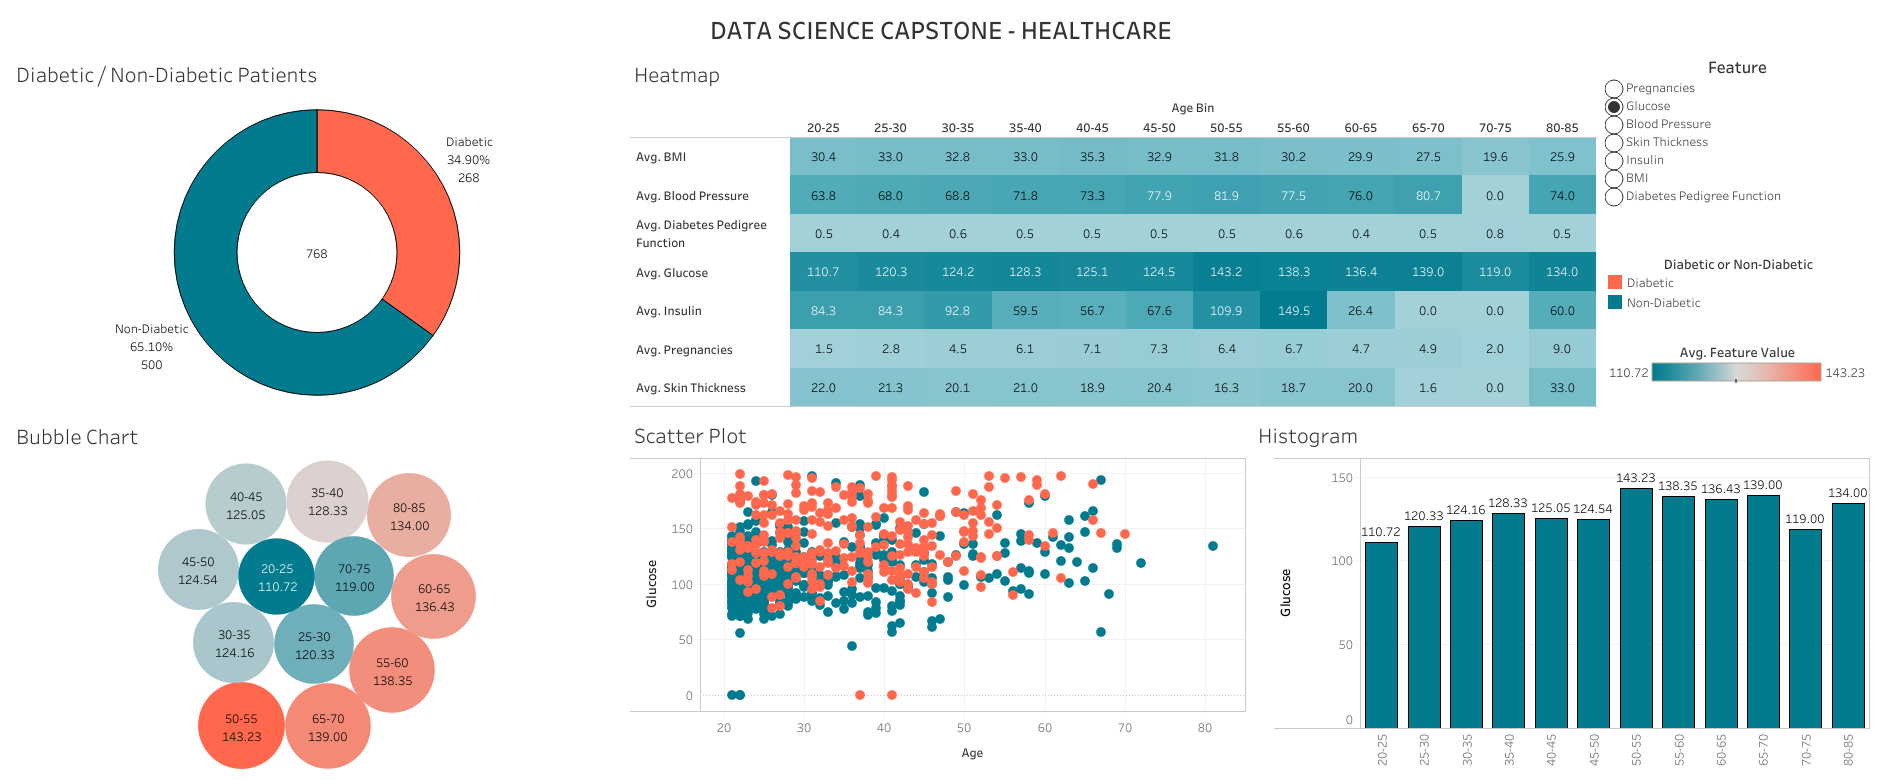
The Data Science Capstone – Healthcare Dashboard, developed using Tableau, aims to provide a comprehensive analysis of healthcare data, focusing on key metrics such as diabetes prevalence, body mass index (BMI), blood pressure, and other health indicators. This interactive dashboard facilitates data-driven decision-making for healthcare professionals, researchers, and policymakers.
Key Features and Insights
- Diabetes Prevalence Analysis
- Diabetes vs. Non-Diabetes Population: The dashboard includes a pie chart that illustrates the proportion of individuals with and without diabetes, offering a clear visual representation of diabetes prevalence within the dataset.
- BMI Distribution Across Age Groups
- BMI Analysis: A bar chart showcases the distribution of BMI across different age groups, highlighting trends and potential risk factors associated with age and body weight.
- Blood Pressure Reports
- Blood Pressure Insights: Detailed reports on blood pressure readings are provided, enabling users to identify patterns and correlations between blood pressure levels and other health metrics.
- Heat Map of Health Variables
- Comprehensive Heat Map: The dashboard features a heat map that displays various health variables, such as glucose levels, insulin levels, and skin thickness, across different age groups. This visualization helps in identifying significant patterns and anomalies.
- Scatter Plots for Correlation Analysis
- Health Metric Relationships: Scatter plots are utilized to explore relationships between different health metrics, such as pregnancies vs. blood pressure and glucose vs. insulin levels, providing insights into potential correlations.
Technology Used
- Tableau: The dashboard is built using Tableau, leveraging its robust data visualization capabilities to create interactive and user-friendly interfaces.
Impact and Applications
- Healthcare Decision-Making: By providing a detailed analysis of critical health metrics, the dashboard aids healthcare professionals in making informed decisions regarding patient care and treatment strategies.
- Research and Policy Development: Researchers and policymakers can utilize the insights from the dashboard to develop targeted interventions and policies aimed at addressing prevalent health issues.
Next Steps
- Predictive Analytics: Integrate predictive modeling to forecast trends in health metrics and disease prevalence.
- Expanded Data Integration: Incorporate additional datasets to enrich the analysis and provide a more comprehensive view of healthcare trends.
- User Training: Conduct training sessions for stakeholders to effectively utilize the dashboard’s features and interpret the visualizations.